Developer API docs
Chart image endpoint
Embed 1600×900 PNG charts of stock fundamentals with one URL: revenue, EPS, margins, daily P/E and other valuation lines, attribution and as-of date in frame.
Documentation updated 2026-09-02. Machine-readable: openapi.json · llms.txt
Endpoint
GET https://tgmcharts.com/api/v1/charts/{symbol}/{metric} renders a 1600×900 PNG (image/png) of the metric's stored history in TGMCharts' own chart style: line charts for daily valuation and yield series, bars for annual, quarterly and TTM statement series. The TGMCharts wordmark and the data-as-of footer are part of the frame — they are the attribution required by the API terms and no parameter removes them.
| Query parameter | Values | Behavior |
|---|---|---|
| years | integer 2–20 | Trailing window. Defaults by basis: 20 years for daily and monthly lines, 10 for annual bars, 3 for quarterly and TTM bars. |
| compare | a second ticker | Grouped comparison bars, bar-chart metrics only. When either series has a negative value the render falls back to the primary series and says so in the subhead. |
| period | annual | quarterly | ttm | daily | Basis alias — 308 to the canonical per-basis slug, like the series endpoint. |
<img src="https://tgmcharts.com/api/v1/charts/AAPL/revenue"
width="800" height="450" alt="AAPL annual revenue — data by TGMCharts" />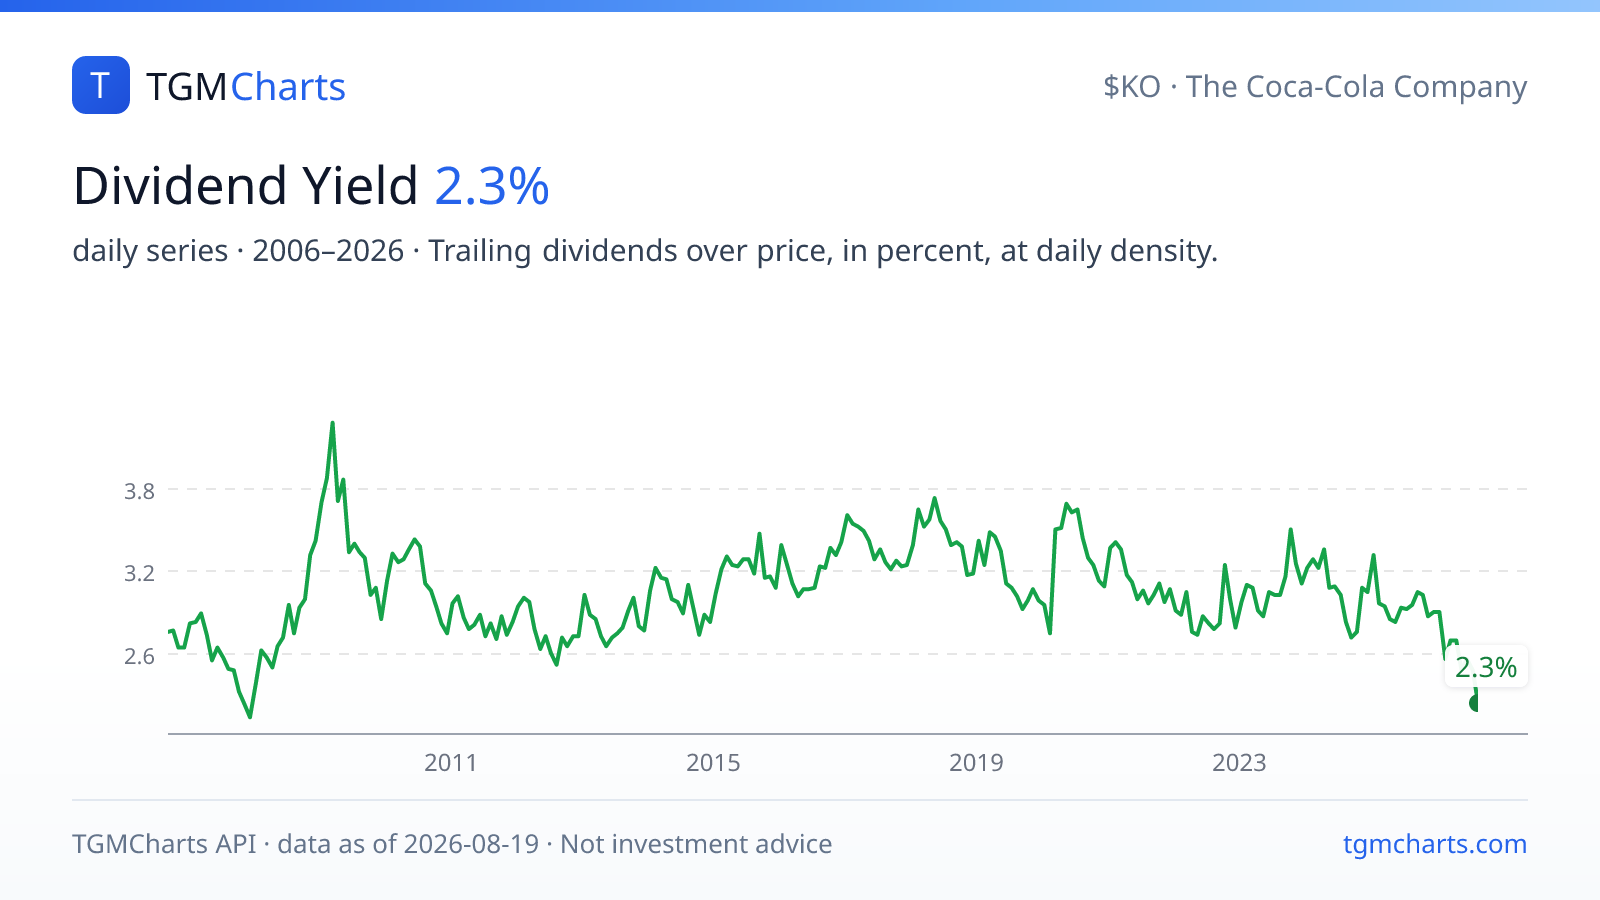https://tgmcharts.com/api/v1/charts/KO/revenue?compare=PEPWhat is in the frame
- Line series are downsampled to at most 300 evenly spaced points; bar series show the most recent 22 periods of the window.
- The headline shows the latest value in the window; the subhead states the basis (daily series, sampled about monthly, by fiscal year, by fiscal quarter, rolling trailing-twelve-month) and the year span; the footer carries the data-as-of date.
- A metric that is not meaningful for the company type, or a symbol with no stored history for it, renders an explanation card at
200— an<img>embed degrades into a readable reason, never blank space or an invented series. - Renders read stored, precomputed data only; no request waits on a live market-data call.
Chart metrics
Generated from the registry the endpoint reads. ?compare= is accepted on bar charts only.
| Metric | Slug | Basis | Chart | Default window | ?compare= |
|---|---|---|---|---|---|
| P/E Ratio | pe-ratio | daily | line | 20 years | no (line) |
| P/S Ratio | ps-ratio | daily | line | 20 years | no (line) |
| P/B Ratio | pb-ratio | daily | line | 20 years | no (line) |
| P/FCF Ratio | pfcf-ratio | daily | line | 20 years | no (line) |
| P/OCF Ratio | pocf-ratio | daily | line | 20 years | no (line) |
| EV/EBITDA | ev-ebitda | daily | line | 20 years | no (line) |
| EV/EBIT | ev-ebit | daily | line | 20 years | no (line) |
| EV/Sales | ev-sales | daily | line | 20 years | no (line) |
| EV/FCF | ev-fcf | daily | line | 20 years | no (line) |
| EV/Assets | ev-assets | daily | line | 20 years | no (line) |
| Earnings Yield | earnings-yield | daily | line | 20 years | no (line) |
| FCF Yield | fcf-yield | daily | line | 20 years | no (line) |
| EBITDA Yield | ebitda-yield | daily | line | 20 years | no (line) |
| OCF Yield | ocf-yield | daily | line | 20 years | no (line) |
| Dividend Yield | dividend-yield | monthly | line | 20 years | no (line) |
| Total Return | total-return | daily | line | 20 years | no (line) |
| ROIC | roic | annual | bars | 10 years | yes |
| Revenue (TTM) | revenue-ttm | ttm | bars | 3 years | yes |
| Net Income (TTM) | net-income-ttm | ttm | bars | 3 years | yes |
| Free Cash Flow (TTM) | fcf-ttm | ttm | bars | 3 years | yes |
| EBITDA (TTM) | ebitda-ttm | ttm | bars | 3 years | yes |
| Capital Expenditure (TTM) | capex-ttm | ttm | bars | 3 years | yes |
| Buybacks (TTM) | buybacks-ttm | ttm | bars | 3 years | yes |
| Stock-Based Compensation (TTM) | sbc-ttm | ttm | bars | 3 years | yes |
| R&D Expense (TTM) | rd-ttm | ttm | bars | 3 years | yes |
| Gross Margin (Quarterly) | gross-margin-quarterly | quarterly | bars | 3 years | yes |
| Operating Margin (Quarterly) | operating-margin-quarterly | quarterly | bars | 3 years | yes |
| Net Margin (Quarterly) | net-margin-quarterly | quarterly | bars | 3 years | yes |
| Revenue | revenue | annual | bars | 10 years | yes |
| Net Income | net-income | annual | bars | 10 years | yes |
| EPS | eps | annual | bars | 10 years | yes |
| Free Cash Flow | free-cash-flow | annual | bars | 10 years | yes |
| EBITDA | ebitda | annual | bars | 10 years | yes |
| Capital Expenditure | capex | annual | bars | 10 years | yes |
| Buybacks | buybacks | annual | bars | 10 years | yes |
| Stock-Based Compensation | stock-based-comp | annual | bars | 10 years | yes |
| R&D Expense | r-and-d | annual | bars | 10 years | yes |
| Gross Margin | gross-margin | annual | bars | 10 years | yes |
| Operating Margin | operating-margin | annual | bars | 10 years | yes |
| Profit Margin | profit-margin | annual | bars | 10 years | yes |
| Return on Equity | roe | annual | bars | 10 years | yes |
| Return on Assets | roa | annual | bars | 10 years | yes |
| Revenue (Quarterly) | revenue-quarterly | quarterly | bars | 3 years | yes |
| Net Income (Quarterly) | net-income-quarterly | quarterly | bars | 3 years | yes |
| EPS (Quarterly) | eps-quarterly | quarterly | bars | 3 years | yes |
| Free Cash Flow (Quarterly) | fcf-quarterly | quarterly | bars | 3 years | yes |
Caching
PNG responses carry Cache-Control: public, max-age=3600, s-maxage=21600, stale-while-revalidate=86400, so a URL that has been requested once is served from the edge; the render refreshes with the daily data update. Do not cache-bust the URL — the same URL is the point.
Render limit
Keyless callers may start up to 30 new (uncached) renders per minute per IP address; cached URLs are not counted. Past the limit the endpoint answers 429 with Retry-After: 60 and the body below. A keyed request is exempt from this limiter and metered at 5 units per render against the account's tier quota instead — see authentication and limits.
{
  "error": "Render rate limit reached — cached chart URLs are unlimited; new renders are capped per minute. API keys lift this to tier quotas: https://tgmcharts.com/developers/keys",
  "upgradeUrl": "https://tgmcharts.com/developers/keys",
  "docs": "https://tgmcharts.com/developers/docs/authentication-and-limits"
}
Errors
400— unknown query key, out-of-rangeyears,compareon a line metric, orcompareequal to the primary symbol.404— symbol not covered (onboarding hint), or a slug outside the chart tier (the body lists everychartMetricsslug).- Error bodies are JSON; only successful renders are
image/png.
FAQ
- Can I embed the chart image in a README, newsletter or app?
- Yes. The URL is the image: put it in an <img> tag or a Markdown image. The frame carries the TGMCharts attribution and the data-as-of date, which satisfies the attribution requirement of the API terms. Keep the frame intact.
- How often do chart images update?
- With the daily data refresh after the US market close. The edge caches a rendered URL for six hours and serves it stale for up to a day while it re-renders, so an embedded chart follows the data within a day.
- Can I remove the TGMCharts wordmark from the chart?
- No. The wordmark and as-of footer are the attribution the API terms require, and no parameter hides them.